📑Table of Contents:
- Social Media Usage Statistics
- Engagement Statistics
- Business and Marketing Statistics
- User Behavior Statistics
- Influencer Marketing Statistics
- Emerging Trends
- Social Media and SEO
- Video Content Statistics
- E-commerce and Social Media
- User Trust and Authenticity
- Social Media Advertising
- Social Media and Customer Service
- Global Social Media Usage
- Social Media and Mobile
- Content Trends
- Social Media Usage by Industry
- Privacy and Security
- Future Predictions
- User Behavior and Engagement
- Social Media Usage Patterns
- Content Creation and Sharing
- Social Media and Branding
- Social Media and Video Marketing
- Social Media and Politics
- Social Media and Content Sharing
- User Engagement with Brands
- Social Media and Influential Users
- User Privacy and Data
- Regional Social Media Preferences
- Video and Live Streaming
- Social Media and the Pandemic
- User Behavior and Influencers
- Future Trends
- Social Media Usage by Age
Last updated on September 20th, 2023 at 09:58 am
Social media has become an integral part of our daily lives and a cornerstone of modern digital marketing strategies. Understanding the latest social media statistics is crucial for businesses, marketers, and individuals aiming to stay ahead of the curve and make informed decisions. In this comprehensive guide, we’ve gathered 160 cool social media stats to help you navigate the ever-evolving landscape of social platforms.
Social Media Usage Statistics
- Global Social Media Users: As of 2021, there were 4.48 billion social media users worldwide, representing 57.6% of the global population.
- Most Popular Social Media Platforms: Facebook remains the most widely used social network, followed by YouTube, WhatsApp, and Instagram.
- Mobile Dominance: Mobile devices account for 98.2% of all social media users.
- Daily Usage: People spend an average of 2 hours and 25 minutes on social media daily.
- Generation Divide: 90.4% of Millennials, 77.5% of Gen X, and 48.2% of Baby Boomers use social media regularly.
Engagement Statistics
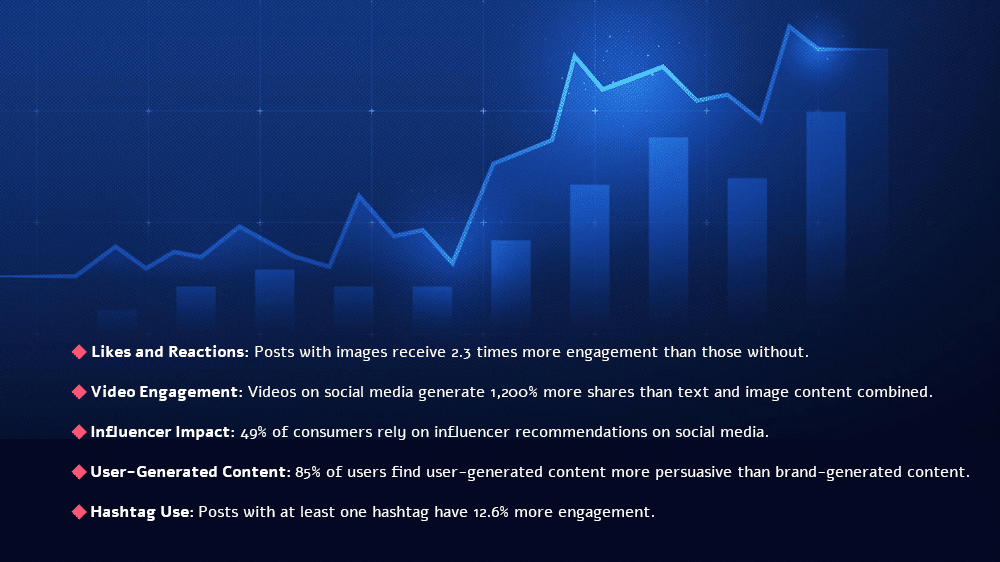
- Likes and Reactions: Posts with images receive 2.3 times more engagement than those without.
- Video Engagement: Videos on social media generate 1,200% more shares than text and image content combined.
- Influencer Impact: 49% of consumers rely on influencer recommendations on social media.
- User-Generated Content: 85% of users find user-generated content more persuasive than brand-generated content.
- Hashtag Use: Posts with at least one hashtag have 12.6% more engagement.
Business and Marketing Statistics
- Business Presence: 91% of retail brands use two or more social media channels.
- ROI: 73% of marketers believe social media marketing has been “somewhat effective” or “very effective” for their business.
- Advertising Spending: Social media advertising spending is expected to reach $105 billion by 2023.
- Conversion Rates: Social media has a 100% higher lead-to-close rate than outbound marketing.
- LinkedIn for B2B: LinkedIn is the most effective platform for B2B marketers, with a 79% effectiveness rate.
User Behavior Statistics
- Video Content: 54% of consumers want to see more video content from brands they support.
- Social Shopping: 54% of users on social media research products through the platform before making a purchase.
- Mobile Shopping: 87% of Pinterest users have purchased a product because of the platform.
- Customer Service: 63% of customers expect companies to offer customer service through social media.
- Privacy Concerns: 68% of Americans are concerned about their privacy on social media.
Influencer Marketing Statistics
- Influencer Budgets: 73% of marketers allocate a budget for influencer marketing.
- Instagram Dominance: 92.4% of influencer campaigns are on Instagram.
- Micro-Influencers: 78% of brands prefer working with micro-influencers due to their higher engagement rates.
- Effectiveness: 89% of marketers find influencer marketing ROI is better than other marketing channels.

Emerging Trends
- Live Streaming: Live video streaming on social platforms has grown by 93% since 2019.
- Augmented Reality (AR): 63% of users say they would try AR filters provided by brands.
- Voice Search: Voice search on social media is expected to rise, with 55% of households projected to own smart speakers by 2022.
- Niche Platforms: Niche social media platforms like TikTok are gaining popularity among younger demographics.
Social Media and SEO
- Social Signals: While Google has stated that social signals (likes, shares, etc.) are not direct ranking factors, there’s a correlation between strong social presence and higher search engine rankings.
- Branded Content: Sharing your blog posts and website content on social media can drive traffic and improve SEO.
- Social Media Profiles: Optimize your social media profiles with relevant keywords and links to your website for improved discoverability.
Video Content Statistics
- YouTube Dominance: YouTube is the second-largest search engine, with over 2 billion logged-in monthly users.
- Live Video Growth: Facebook Live broadcasts have grown by over 50% since the beginning of 2020.
- Short-Form Videos: Short-form video platforms like TikTok have over 1 billion monthly active users.
- Video Storytelling: 68% of people prefer to learn about new products or services through short videos.
- Story Views: Instagram Stories have over 500 million daily active users.
E-commerce and Social Media
- Shopping on Instagram: 130 million Instagram users tap on shopping posts every month.
- Buy Buttons: 75% of consumers have purchased something because they saw it on social media.
- Social Commerce Growth: Social commerce is expected to reach $84.2 billion by 2022.
- Pinterest as a Shopping Hub: 78% of Pinterest users find new products on the platform. Read more posts about E-commerce tricks and strategies.
User Trust and Authenticity
- Trust in User-Generated Content: 92% of consumers trust recommendations from individuals (even if they don’t know them) over brands.
- Brand Authenticity: 86% of consumers believe authenticity is important when deciding which brands they like and support.
- Fake News Awareness: 58% of people are concerned about the spread of fake news on social media.
- Transparency: 63% of consumers believe transparency is one of the most attractive qualities of a brand.
Social Media Advertising
- Ad Blocking: 30% of internet users are expected to use ad blockers in 2023.
- Ad Engagement: The average click-through rate (CTR) for Facebook ads is 0.9%.
- Ad Targeting: 73% of marketers believe social media advertising is effective for lead generation.
- Native Advertising: Native ads on social media platforms are expected to drive 74% of all ad revenue by 2021.
Social Media and Customer Service
- Response Time Expectations: 32% of customers expect a response to their inquiry within 30 minutes on social media.
- Complaints on Social Media: 45% of customers share negative experiences on social media.
- Positive Interactions: 71% of consumers who have had a positive experience with a brand on social media are likely to recommend that brand to others.
- Chatbots for Support: 56% of consumers prefer using chatbots for customer service inquiries.
Global Social Media Usage
- Asia-Pacific Domination: Asia-Pacific has the largest number of social media users, with over 2.4 billion.
- North America: North America has a social media penetration rate of 70%, with the United States being a significant contributor.
- European Usage: 48% of the European population uses social media regularly.
- Latin America: In Latin America, 59% of the population are active social media users.

Social Media and Mobile
- Mobile-First Usage: 91% of social media users access platforms via mobile devices.
- Mobile Ad Spending: Mobile advertising accounted for 94% of Facebook’s advertising revenue in 2020.
- App Downloads: TikTok was the most downloaded app globally in 2020, with over 2 billion downloads.
- Messaging Apps: WhatsApp and Facebook Messenger collectively have 2.6 billion monthly active users.
- Mobile Video: 90% of Twitter video views occur on mobile devices.
Content Trends
- User-Generated Video: 86% of businesses use user-generated content in their marketing efforts.
- Interactive Content: Interactive content such as polls and quizzes on social media generates twice as many conversions as static content.
- Podcasting Growth: In 2020, there were over 1.75 million podcasts and 43 million podcast episodes.
- LinkedIn Publishing: LinkedIn is the top platform for B2B content distribution, with 97% of B2B marketers using it for content.
- Ephemeral Content: 64% of marketers have either incorporated Instagram Stories into their strategies or plan to do so.
Social Media Usage by Industry
- Healthcare: 47% of healthcare organizations use social media for professional networking.
- Education: 71% of college students use Instagram daily, making it a key platform for educational institutions.
- Travel: 84% of travelers use social media for inspiration in planning their trips.
- Retail: 72% of luxury fashion brands are on Instagram, showcasing the platform’s significance in the retail industry.
- Tech: Tech companies invest 48% of their ad budgets in digital marketing, including social media.
Privacy and Security
- Data Breach Concerns: 53% of users worry about the privacy of their personal information on social media.
- Platform Trust: 76% of people trust Facebook the least with their data.
- GDPR Compliance: The EU’s General Data Protection Regulation (GDPR) has resulted in increased privacy protection measures by social media companies.
- Ad Personalization: 57% of consumers are comfortable with ad personalization based on their online behavior.
Future Predictions
- Virtual Reality (VR): By 2023, it’s projected that 10% of the world’s population will use VR regularly.
- Social Commerce Expansion: The convergence of social media and e-commerce is expected to accelerate, making it easier for users to shop directly through platforms.
- Voice Assistants: More social media platforms are expected to integrate voice assistants, allowing for voice interactions and searches.
- Niche Platforms: Specialized social media platforms catering to specific interests or demographics will continue to gain popularity.
- AI-Powered Content: AI will play a more significant role in content creation and personalization on social media. Read more about SEO and AI-generated content.

User Behavior and Engagement
- Frequent Posting: 92% of companies that publish content multiple times a day acquire a customer through their blog.
- Social Listening: 59% of social marketers use social listening tools to monitor brand mentions.
- Twitter Engagement: Tweets with images receive 150% more retweets than tweets without images.
- Response Time: 42% of customers expect a response on social media within 60 minutes.
- Customer Expectations: 54% of customers want brands to respond to comments and questions on social media.
Social Media Usage Patterns
- Social Media Addiction: 59% of adults admit to being addicted to their social media accounts.
- User Engagement: 54% of users use social media to research products.
- Multiple Account Holders: 85% of internet users have multiple social media accounts.
- Time Spent: On average, users spend 15 minutes per day on Instagram.
- User Growth: Snapchat added 39 million daily active users in 2020, reaching a total of 265 million. Content Creation Frequency: 87.1 million photos are uploaded to Instagram daily.
Content Creation and Sharing
- User-Generated Content (UGC): Posts with UGC have a 28% higher engagement rate than standard company posts.
- Sharing Behavior: 76% of people share interesting content they find on social media.
- Visual Content: 40% of marketers say that original graphics perform best on social media.
- Content Recycling: Sharing the same content multiple times can boost engagement by 376%.

Social Media and Branding
- Brand Pages: 71% of consumers who have had a positive experience with a brand on social media are likely to recommend it to others.
- Brand Engagement: 80% of consumers expect brands to respond to comments within 24 hours.
- Brand Personality: 75% of consumers expect brands to be fun on social media.
- Brand Advocacy: 79% of marketers believe that user-generated content plays a significant role in their marketing strategy.
- Employee Advocacy: Employee-shared content gets 8 times more engagement than content shared by brand channels.
Here’s our in-depth blog post about online store rebranding guidelines. You may love to read that.
Social Media and Video Marketing
- Live Streaming: 80% of users prefer to watch live video from a brand than read a blog.
- YouTube Searches: YouTube is the second-largest search engine, with more than 2 billion logged-in users.
- Facebook Watch: 75 million people spend at least 1 minute daily on Facebook Watch.
- Video Ads: 92% of mobile video viewers share videos with others.
- Facebook Video: Facebook’s video platform has over 1.25 billion monthly users.
Social Media and Politics
- Political Engagement: 66% of social media users have engaged with political content in some way.
- Misinformation: 64% of users say fake news stories due to “a great deal” of confusion about raw facts of current incidents.
- Political Ad Spending: The 2020 U.S. presidential election saw over $3 billion spent on digital advertising, including social media.
- Political Activism: 25% of adults use social media to follow political figures or engage in political discussions.
- Polarization: 64% of Americans believe that fake news has caused “a great deal” of confusion about basic facts of current issues.
Social Media and Content Sharing
- Content Sharing: On Facebook, there are over 2.8 billion monthly active users who share content with their connections.
- Twitter Retweets: Tweets with images receive 150% more retweets than text-only tweets.
- Pinterest for Inspiration: 77% of weekly Pinterest users have discovered a new brand or product on the platform.
- LinkedIn Content: LinkedIn users share 3 million posts daily, and the platform’s articles receive 9 billion content impressions every week.
- Snapchat Stories: Over 4 billion Snapchat stories are created each day.
User Engagement with Brands
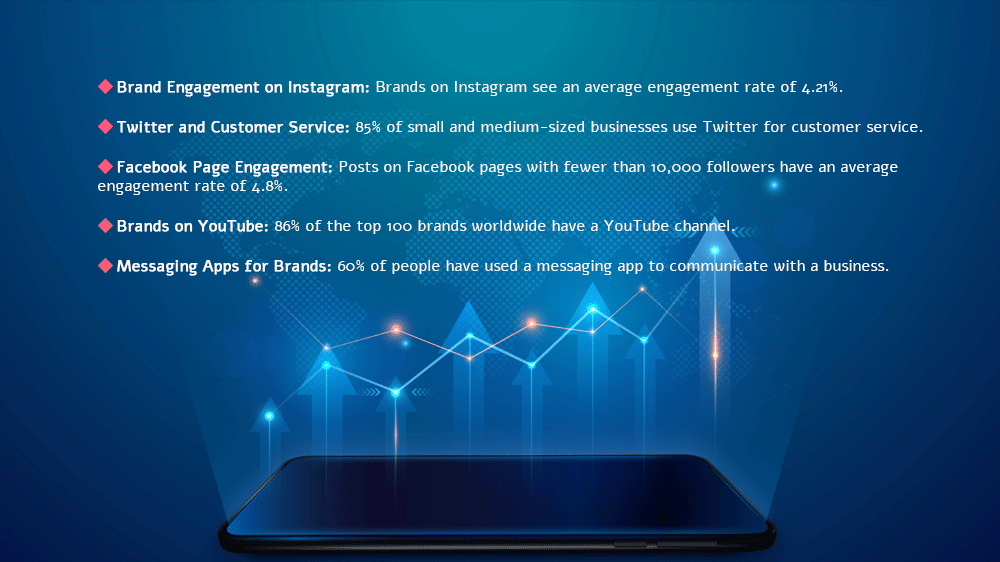
- Brand Engagement on Instagram: Brands on Instagram see an average engagement rate of 4.21%.
- Twitter and Customer Service: 85% of small and medium-sized businesses use Twitter for customer service.
- Facebook Page Engagement: Posts on Facebook pages with fewer than 10,000 followers have an average engagement rate of 4.8%.
- Brands on YouTube: 86% of the top 100 brands worldwide have a YouTube channel.
- Messaging Apps for Brands: 60% of people have used a messaging app to communicate with a business.
Social Media and Influential Users
- Twitter Influencers: Tweets from influencers receive, on average, 54% more engagement than regular users’ tweets.
- LinkedIn Thought Leaders: LinkedIn’s top thought leaders garner millions of followers and engagement on their content.
- Instagram Influencer Rates: The average price per post for influencers on Instagram with 100,000 to 1 million followers is $1,000.
- YouTube Stars: The highest-earning YouTuber in 2020 made $29.5 million.
- TikTok Influencers: TikTok influencers can earn between $200 and $20,000 per branded video.
User Privacy and Data
- Privacy Concerns: 53% of adults feel that it is not very or not at all difficult to manage privacy settings on social media.
- Data Collection: 63% of users are unaware of how their data is collected and used on social media platforms.
- Data Leaks: In 2019, Facebook faced a data breach that exposed 419 million user records.
- Ad Tracking: 72% of users say they are annoyed by ad retargeting.
- GDPR Impact: The EU’s General Data Protection Regulation (GDPR) led to increased privacy measures and transparency on social media platforms.
Regional Social Media Preferences
- Weibo in China: Weibo, a Chinese microblogging platform, has over 530 million monthly active users.
- VKontakte in Russia: VKontakte, a Russian social media platform, has 97 million monthly active users.
- Orkut in Brazil: Orkut, which was once popular globally, still has a user base in Brazil.
- Line in Japan: Line, a messaging app, has over 86 million monthly active users in Japan.
- KakaoTalk in South Korea: KakaoTalk, a South Korean messaging app, has over 50 million monthly active users.
Video and Live Streaming
- Twitch Viewership: Twitch, a live streaming platform, has over 140 million monthly users who watch an average of 95 minutes of content per day.
- Facebook Live: Facebook Live videos generate 10 times more comments from users than regular videos.
- Video Content-Length: 56% of videos published in the last year are less than 2 minutes long.
- Live Streaming Engagement: Live videos on YouTube are watched by more people and for longer durations compared to recorded videos.
- TikTok’s Popularity: TikTok was the most downloaded app in the world in 2020, with 850 million downloads.
Social Media and the Pandemic
- Pandemic Impact: In 2020, daily time spent on social media platforms increased by 21.3%, largely due to the COVID-19 pandemic.
- Pandemic Content: 64% of consumers want brands to create content that addresses the current pandemic.
- Remote Work: LinkedIn saw a 55% increase in conversations among connections in March 2020 as remote work surged.
- E-commerce Boom: Online sales in the U.S. surged 76% year-over-year in June 2020, driven by social commerce.
- Social Causes: Social media played a significant role in raising awareness and funds for COVID-19 relief efforts and social justice causes.
User Behavior and Influencers
- Trust in Influencers: 58% of consumers trust influencers more than the brand’s messaging.
- Influencers vs. Celebrities: 67% of consumers say they trust reviews and recommendations from influencers more than celebrities.
- Content Authenticity: 51% of users say they would unfollow an influencer who promotes inauthentic content.
- Influencer Collaboration: 71% of marketers say they have a specific budget for influencer marketing.
- Social Media Impact: 54% of social browsers use social media to research products.

Future Trends
- Social Commerce Growth: By 2025, social commerce is predicted to make up 10% of all retail sales.
- AI-Powered Chatbots: The adoption of AI-powered chatbots for customer service is expected to increase by 136% by 2022.
- Social VR: Social Virtual Reality platforms like Facebook Horizon are expected to gain traction, allowing users to interact in virtual spaces.
- Long-Form Content: Despite the rise of short-form content, long-form content on platforms like LinkedIn and Medium remains popular.
- Social Media Metrics: The focus on metrics like engagement rates, click-through rates, and conversion rates will continue to drive social media strategies.
Social Media Usage by Age
- Teen Usage: 84% of teenagers in the United States report using Instagram, while 81% use Snapchat.
- Young Adults: 90% of young adults aged 18-29 use social media.
- Middle-Aged Users: 77% of adults aged 30-49 are active on social media.
- Seniors Online: 53% of adults aged 50-64 use social media, and 25% of those aged 65 and older use social platforms.
- Generational Preferences: Generation Z (born 1997-2012) primarily uses TikTok, Millennials (born 1981-1996) favor Instagram, and Generation X (born 1965-1980) is most active on Facebook.
- Teen TikTok-er: 26% of teens use TikTok, making it a significant platform for this generation.
Closing Thoughts!
In conclusion, social media stats are not just numbers but powerful tools that can drive your online success. By understanding their significance, monitoring the right metrics, and using the data strategically, you can unlock the full potential of your social media presence. Stay tuned for more insights on how to make data-driven decisions that will propel your brand to new heights in the digital landscape.